


★
(0 Reviews)
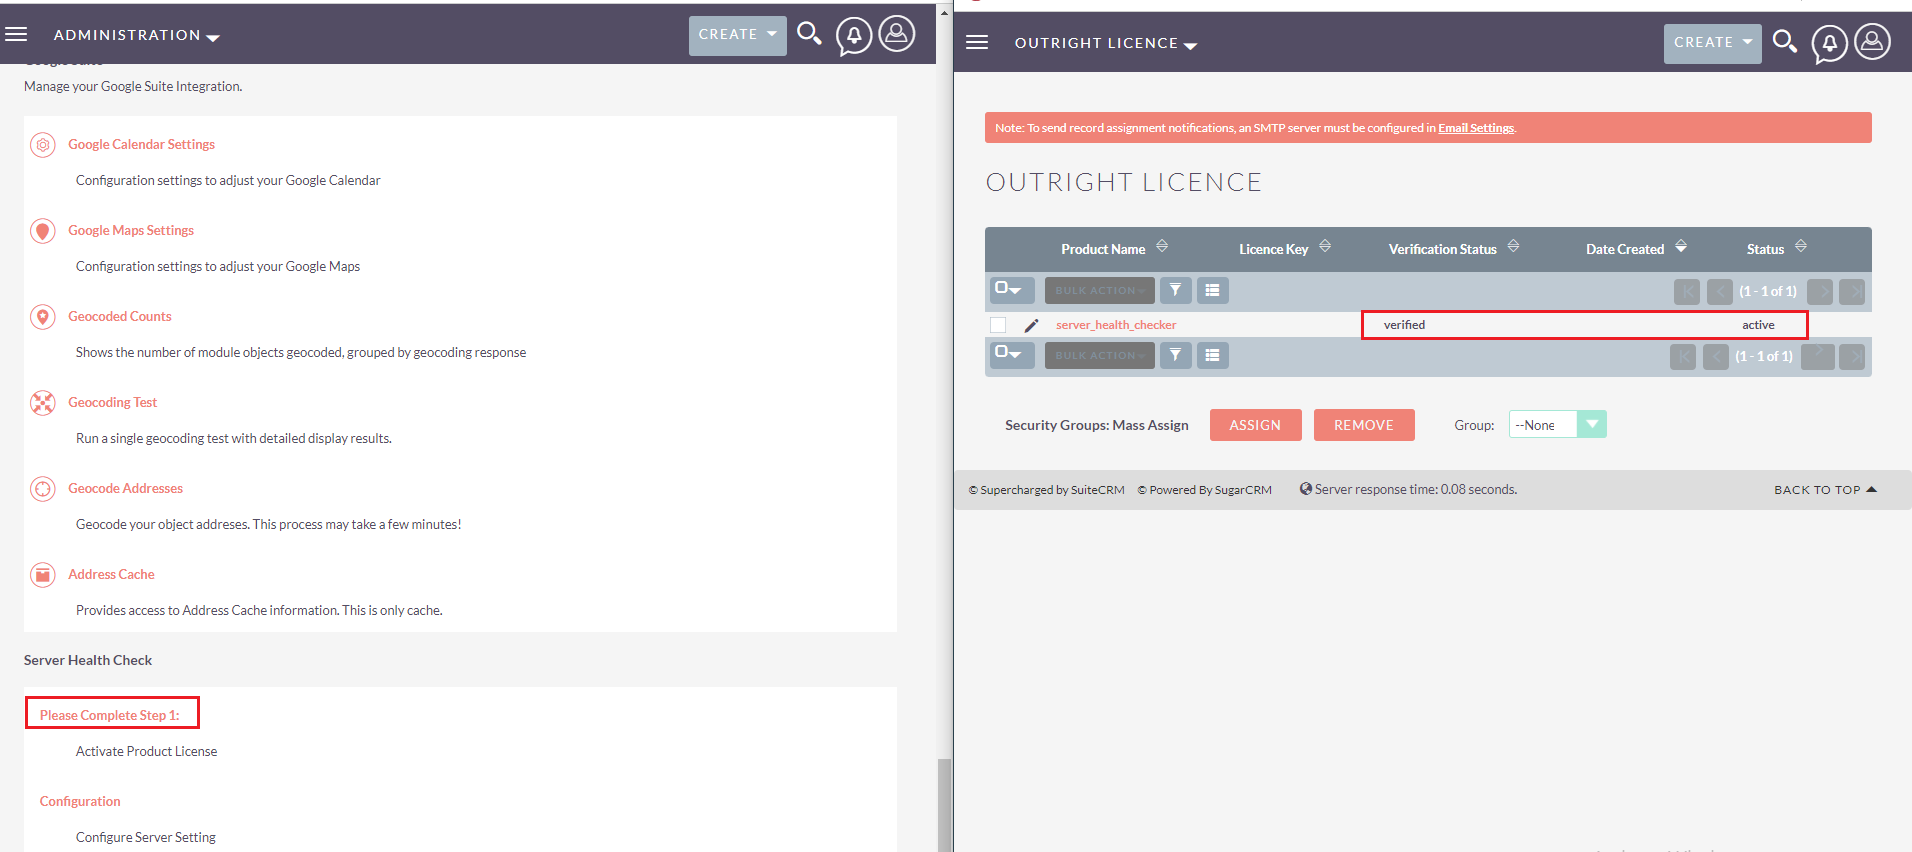
Server Health Check
$0.00
Product Description
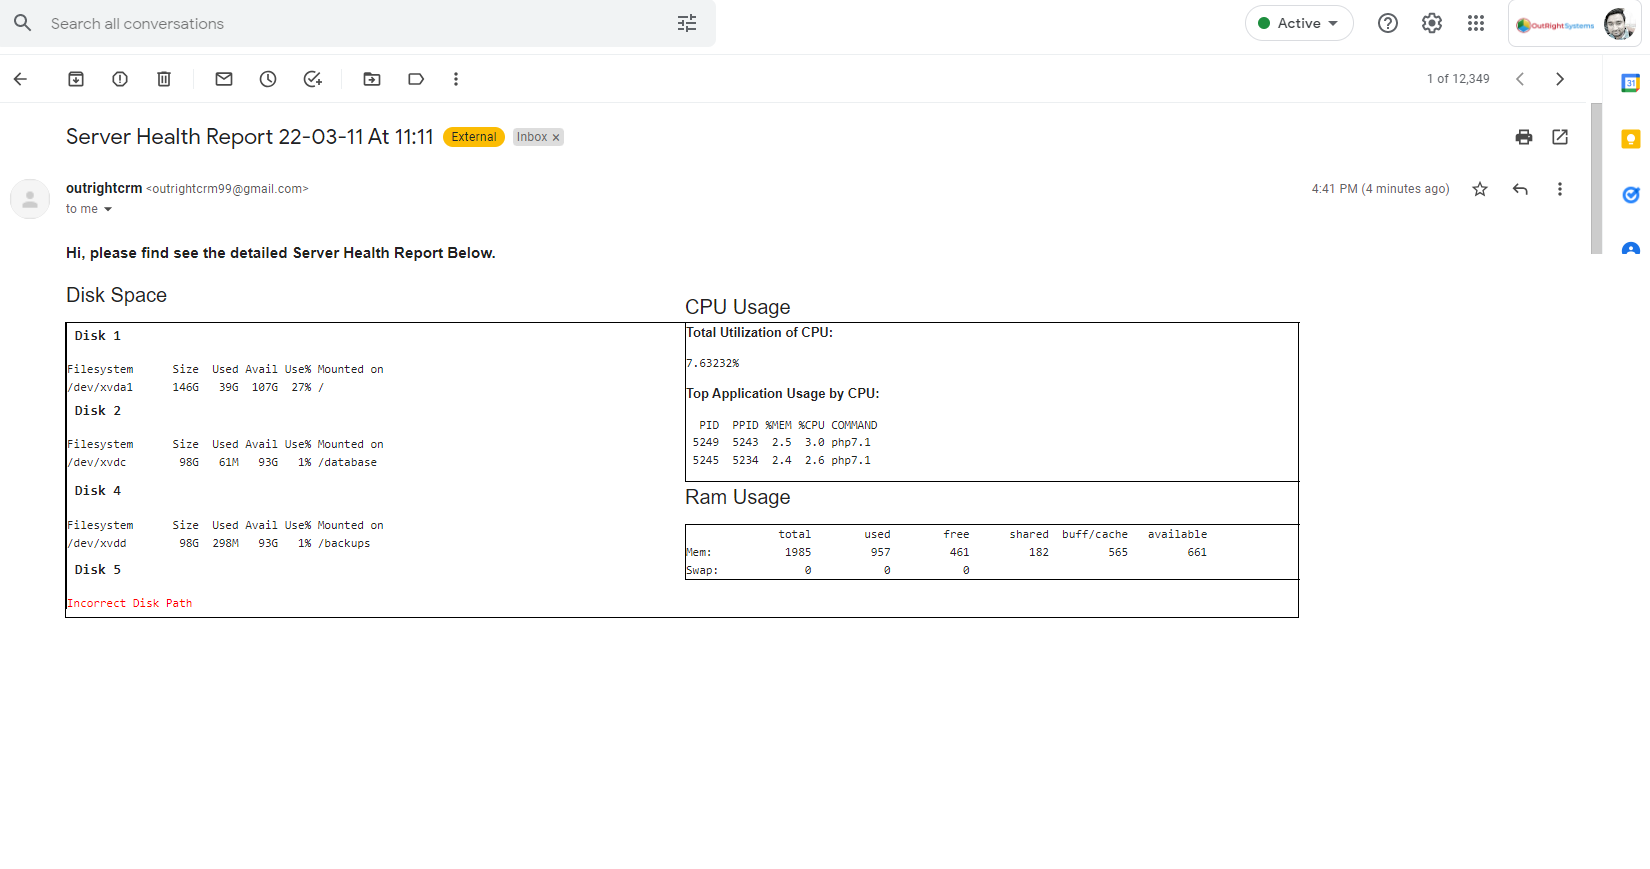
An optimal Server Health means proper functioning of applications and business at all times. In order to monitor the server health, we have built an extension that dynamically Monitors as well as sends the Server Health report on email. This SuiteCRM plugin is called “Server Health Check” and it will provide you with a detailed view of server health status. The health check report will include Disk Space, Application wise CPU Usage, and RAM Consumption. So whenever each of these components crossed the prescribed threshold or when your server reaches a critical point, you will get an email instantly. The plugin 24/7 monitors the server so that you can resolve any issues as soon as possible.
Real-Life Example: Suppose a team of numerous members working on the server. And suddenly you notice the performance is downgraded and some even can’t create a new record in the software. Unfortunately, no one has the access to the server due. So what will you do next? However, if you can somehow check out the used disk space then you could find the resolution. The Server Health Check plugin will allow you to track the primary disks of your server, CPU usage, and RAM Consumption. It will even notify you when the disk space crosses a certain part of storage like 80%.

Key Features
Discover what makes this product stand out

Key Features of SuiteCRM Server Health Check
- Complete server snapshot: Monitor Disk Usage, CPU Load, and RAM Status in one report.
- Threshold alerts: Get notified when disk or CPU crosses your configured limit.
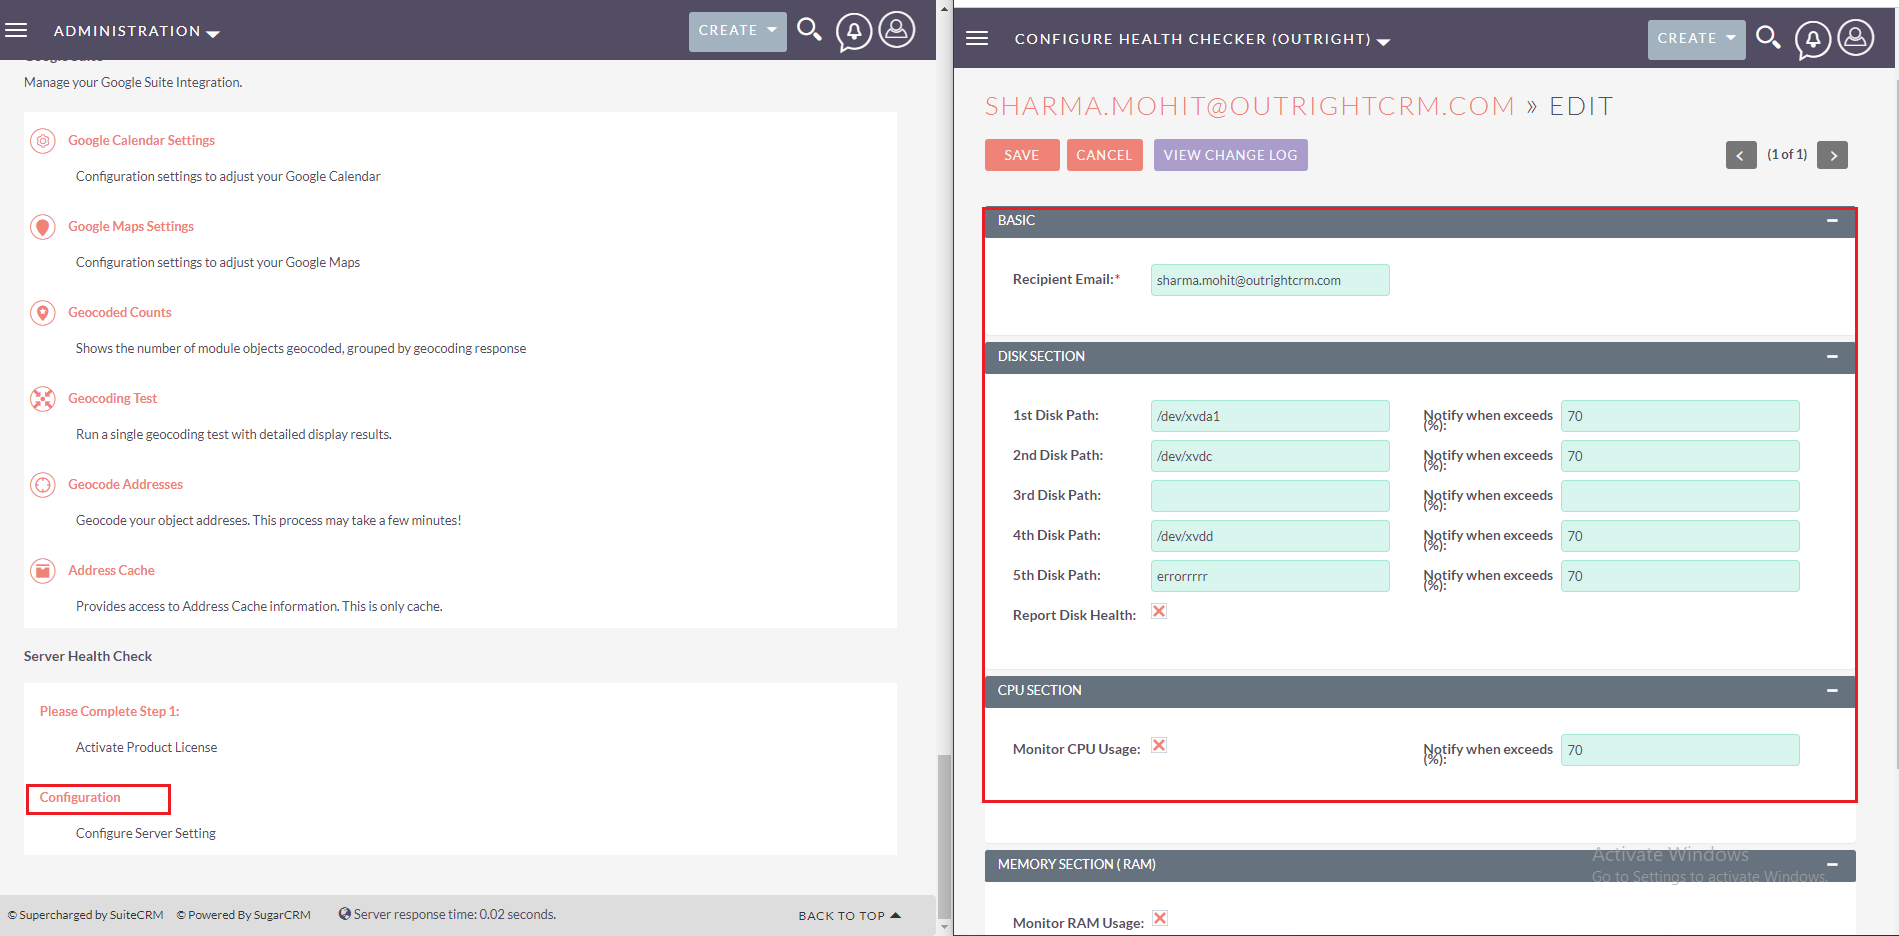
- Custom threshold setup: Easily configure threshold values for CPU and each disk.
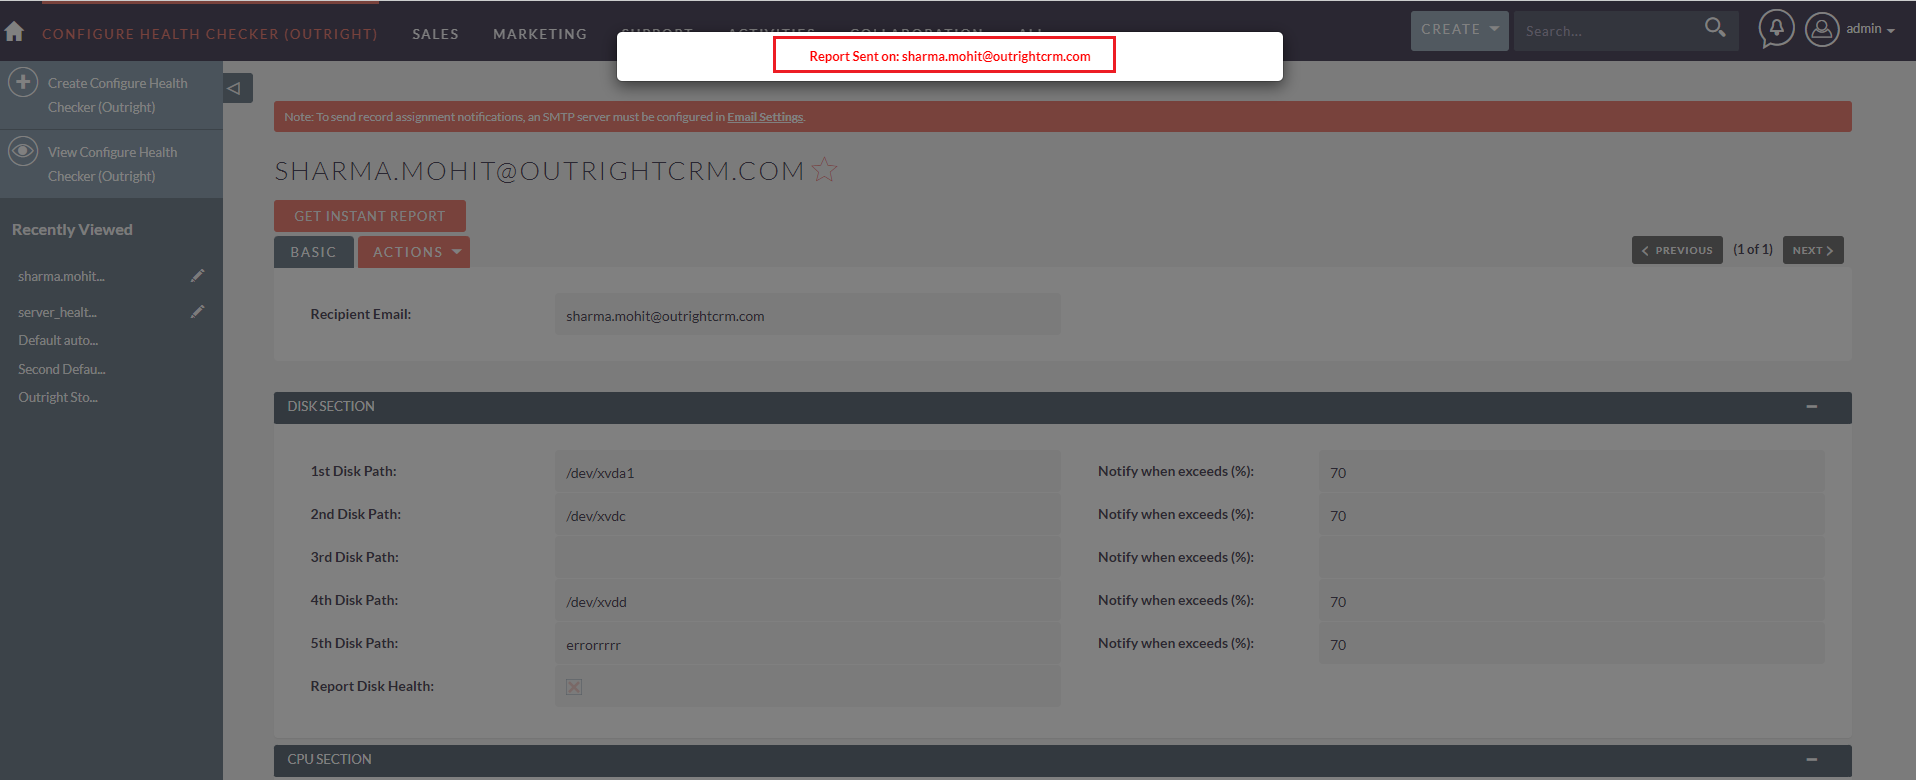
- Real-time usage report: Instantly check current server health from within SuiteCRM.
- Daily summary email: Receive daily health reports via email for proactive monitoring.
- Monitor up to 5 disks: Add and track health for up to five server disks separately.
- Flexible email delivery: Send reports to any configured email address of your choice.
- Simple interface: Easy-to-read dashboard for reviewing server health status quickly.
- Avoid server crashes: Take preventive action before server performance drops.
- Lightweight extension: Minimal load on the server while delivering maximum value.


Visual Showcase
See the product in action through screenshots

1
2
3
4
Product Videos
Watch our product in action
User Guide
Learn how to use and configure the system step by step
Customer Reviews
See what our customers are saying
FAQs
Question? Look here.
What does the Server Health Check plugin monitor?
The plugin monitors the status of three major server components: Disk Space, CPU Usage, and RAM Consumption. It provides both instant and daily health reports to keep your server performance in check.
Can I set threshold alerts for Disk and CPU usage?
Yes! You can configure custom threshold values for both disk space and CPU usage. For example, set an alert for when disk usage crosses 75%, and the system will automatically send a warning email when it happens.
Is it possible to monitor multiple disks at once?
Absolutely. The plugin supports monitoring up to 5 different disks. You can view their usage individually and receive detailed stats for each disk in the reports.
How do I receive the Server Health Reports?
You will receive both instant reports (on demand) and daily summary reports via email. You can configure the plugin to send reports to any email address of your choice
Do I need technical expertise to configure this plugin?
No, the plugin is designed with a user-friendly interface. Setting threshold values, adding email addresses, and configuring disks can be done easily without technical skills.