Introduction
IoT Data visualization is the process of analyzing and displaying data gathered from IoT devices using visual representation methods like graphs, charts, and maps. It is an essential component of the Internet of Things (IoT) since it aids in the interpretation of the massive volumes of data produced by networked devices. Stakeholders can track system performance, spot anomalies, gather insightful data, and make data-driven decisions with the help of IoT visualization.
In this blog, we’ll learn about IoT data visualization, its types, benefits, and importance. We’ll also discuss the applications and future of data visualization in IoT.
Let’s start by understanding,
What is IoT Data Visualization?
Visualizing data from linked devices in a graphical or pictorial style is known as Internet of Things data visualization. It turns unprocessed data and statistics into visually appealing parts that are simple to understand, like interactive dashboards, graphs, and charts. IoT data visualization helps companies and individuals find trends, obtain important insights, and make data-driven decisions by simplifying and making complicated data sets easier to access and comprehend.
Types Of IoT Data Visualization
Organizations can use a variety of IoT visualization approaches to evaluate and present IoT data. These are a few of the most typical kinds −
- Real-time dashboards: These are interactive interfaces that provide a visual representation of real-time data from the Internet of Things devices. Key performance indicators (KPIs), trends, and warnings can be added to them, enabling users to promptly recognize and address problems as they emerge.
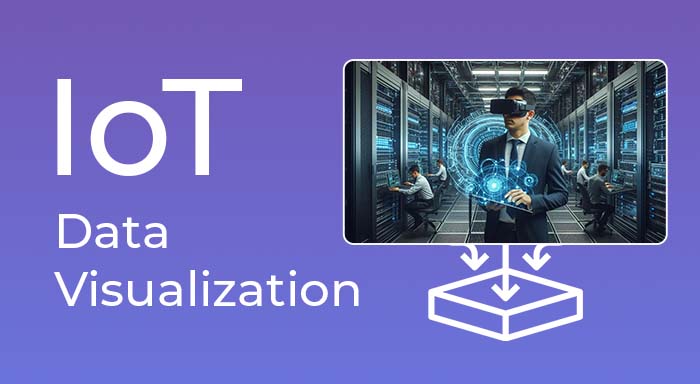
- 3D visualizations: These immersive visualizations offer a more realistic and interactive perspective of IoT data by utilizing 3D models and virtual reality (VR) technologies. They help provide a more comprehensible visual representation of intricate and multifaceted IoT data.
- Heat maps and choropleths: These are examples of geographic visualizations that show functional blocks of IoT in particular areas or regions using color-coded maps. IoT data is displayed as a concentration or density on heat maps and as a per-capita or per-unit area on choropleths.
- Graphs and charts: These are classic visualization methods that show relationships, trends, and patterns in IoT data using graphs and charts. In IoT visualization, line graphs, bar charts, and pie charts are often used as chart forms.
Maps and geospatial visualizations: These are visualizations that show Internet of Things data in a spatial context by utilizing maps and geospatial data. They can be applied to the analysis of data from IoT devices, such as traffic monitoring or weather sensors, that are dispersed over wide geographic areas.
Pro tip: IOT data often comes as complex and deeply nested JSON or XML. Before you can visualise IOT data you need to convert the XML / JSON to a relational or tabular format. You are best off using an XML conversion tool like this one from Sonra to automate this step in the process.
Benefits Of IoT Data Visualization
Organizations can use IoT visualization to enhance their operations and decision-making procedures in some ways. These are a few of the biggest advantages −
- Quicker detection and resolution of problems − Organizations can swiftly detect flaws and possible difficulties with IoT visualization, allowing them to take remedial action before they affect operations. IoT Visualization can help firms react rapidly to developing issues, limiting downtime and operational damage, by offering real-time insights into IoT data.
- Better Decision-Making: IoT Visualization gives decision-makers instant access to data-driven, real-time insights into the operation of linked devices and systems. This enables decision-makers to make more well-informed choices. IoT Visualization assists decision-makers in identifying trends, patterns, and anomalies that might not be visible in text-based reports by presenting data in a meaningful and comprehensible manner.
- Enhanced operational effectiveness – By offering real-time insights into the performance of linked devices and systems, IoT visualization can assist enterprises in optimizing their operations and enhancing effectiveness. IoT Visualization can help firms detect and address issues before they become serious ones, minimizing downtime and increasing overall operational efficiency. It does this by monitoring and analyzing data in real time.
- Improved data comprehension: IoT visualization offers a more thorough perspective of IoT data, simplifying the comprehension and interpretation of large and intricate data sets for consumers. IoT Visualization can assist users in finding links and correlations that might not be immediately obvious from raw data by displaying data in a variety of formats.
Importance Of IoT Data Visualization
IoT data visualization is significant because it may convert unprocessed data into useful insights that influence corporate choices. IoT visualization may help businesses optimize operations, boost productivity, and improve customer satisfaction by giving real-time insights into the performance of connected devices and systems.
Additionally, IoT visualization can help spot patterns and trends in data that text-based reports might not be able to show right away. Better decision-making and a more thorough knowledge of the data may result from this.
IoT Visualization Applications
IoT visualization has numerous applications across various industries.
- Retail: Physical businesses can employ IoT data visualization to improve inventory management, analyze customer behavior, and enhance the entire shopping experience.
- Industrial Internet of Things (IoT): Manufacturers may identify bottlenecks, monitor production processes, and increase productivity with the use of IoT visualization. The visualization of sensor data on machines may enable predictive maintenance, reducing downtime.
- Smart Cities: Data analysis from networked sensors and devices across the infrastructure of the city may be analyzed via visualization, which helps planners and administrators better comprehend traffic flow, control waste, and improve municipal services.
- Healthcare: Wearable technologies and medical devices provide data that may be seen to improve patient care and promote early action by tracking patient health, spotting problems, and providing choices for remote monitoring.
- Smart Homes: By utilizing data visualization from smart devices, homeowners can keep an eye on energy consumption, spot security breaches, and create personalized automation routines.
- Agriculture: Internet of Things sensors put in farms and greenhouses offer data on crop health, weather, and soil moisture. By displaying this data, farmers can increase crop yields, use less water, and make informed decisions.
IoT Levels Explained: A Deep Dive into the Internet of Things Hierarchy
Advantages & Disadvantages of IoT
The Future of IoT Data Visualization
As communication protocols in IoT technology continues to evolve, we can expect several exciting developments in data visualization:
- Augmented and Virtual Reality: AR and VR technologies will enable more immersive and interactive visualizations of IoT data, allowing users to explore complex datasets in three-dimensional space.
- AI-Powered Insights: Machine learning algorithms will increasingly be used to automatically identify patterns, anomalies, and insights in IoT data, presenting them through intelligent visualizations.
- Edge Computing: As more processing power moves to the edge, we'll see more sophisticated visualizations generated closer to the data source, reducing latency and improving real-time analytics.
- Natural Language Interfaces: Voice-activated and natural language processing technologies will make it easier for users to interact with and query IoT data visualizations.
Conclusion
IoT data visualization is a great method for transforming complex IoT data into insightful information. By employing various visualization techniques and leveraging data from several sources, individuals and institutions can improve their ability to make decisions, optimize processes, and achieve the most benefits from their Internet of Things endeavors. As the Internet of Things grows, so does the significance of visualization in aiding in the understanding of the huge data environment.
Related Posts
Learn the Ideas Behind the Logical and Physical Designs of IOT
Internet of Things | IoT Design Methodology And Its Importance


