


The Sales Director at a mid-sized software firm had a paradoxical observation: deals were closed and overall revenue was good, yet profitability did not match. A detailed analysis of her CRM database uncovered why: it took three times more money to attract a new customer than to keep an old one, yet her team was pouring 80 percent of their time and effort into new sales. With her newfound reliance on data-driven CRM analytics, she changed her priorities and boosted profit margins by 34 percent in half a year. The secret to your profit margin improvement might just lie within your CRM system. When done properly, important CRM metrics can reveal hidden patterns in buyer behavior and revenue expansion.
Comprehensive Summary of CRM Metrics
| Aspect | Key Takeaway |
| Customer Acquisition Cost | The total expense of gaining a new customer directly impacts profitability and marketing efficiency. |
| Customer Lifetime Value | Understanding long-term customer worth helps prioritize retention strategies and resource allocation. |
| Sales Conversion Rates | Tracking how prospects move through your pipeline reveals bottlenecks and optimization opportunities. |
| Customer Retention Metrics | Measuring loyalty and churn identifies at-risk accounts before they leave your business. |
| Sales Cycle Length | Shorter sales cycles mean faster revenue realization and improved forecasting accuracy. |
| Lead Response Time | Quick follow-ups dramatically increase conversion chances and demonstrate customer-centricity. |
Understanding CRM Metrics and Their Business Impact
CRM metrics are unique or quantifiable pieces of information pulled from your customer relationship management system to measure your business performance. To fully grasp what is CRM and how it transforms business operations, understanding these metrics is essential.
These measurements fall into three categories that align with the core objectives of CRM:
- Revenue measurement indicators for sales performance metrics
- Metrics for customer health regarding relationship quality
- Operational efficiency metrics that focus on process effectiveness
The key benefit of CRM metric tracking is the predictive nature of the outcomes. Harvard Business Review concluded that companies relying on their data are 23 times more successful at getting new customers and 6 times more successful at retaining the existing ones. CRM metrics give the possibility to be objective and not make assumptions.
Critical Sales Performance CRM Metrics
Customer Acquisition Cost (CAC)
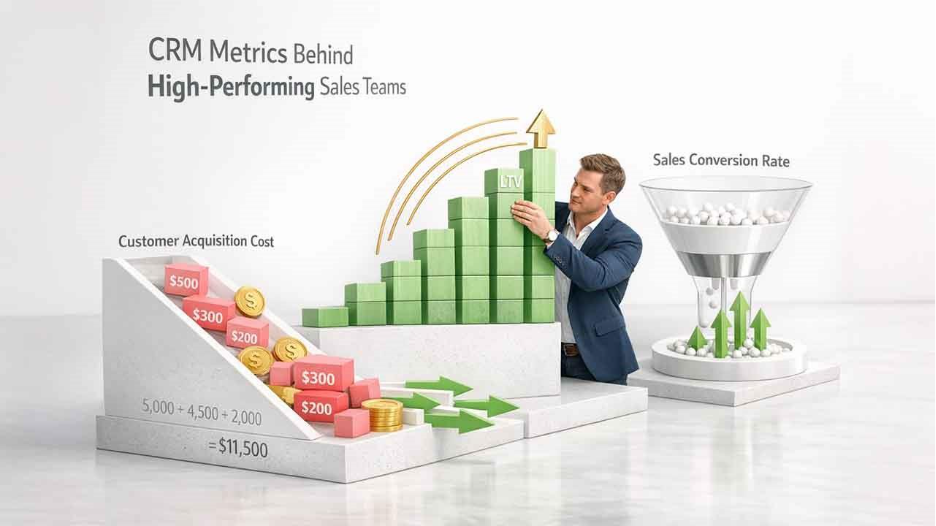
Customer Acquisition Cost measures the total expense required to gain one new customer.
Calculation: Total Sales and Marketing Expenses ÷ Number of New Customers Acquired
If you spent 50,000 dollars on sales and marketing last month and gained 50 customers, your CAC is 1,000 dollars. This CRM metric includes salaries, software costs, advertising spend, and overhead allocation.
Why it matters: CAC shows the direct effect on the profitability timeline. According to the Journal of Marketing findings, companies with ratios higher than 1:3 in CAC to LTV will find it challenging to grow. CAC analysis by channel will help to identify the sources of the best-performing customers.
Customer Lifetime Value (CLV or LTV)
Customer Lifetime Value predicts the total revenue a customer generates throughout their relationship with your business.
Calculation: (Average Purchase Value × Purchase Frequency × Customer Lifespan)
For subscription businesses: Monthly Recurring Revenue × Gross Margin × (1 ÷ Monthly Churn Rate)
The LTV of a customer paying $100 per month, on average, over 24 months, is $2,400. This is very useful when measured against CAC. The best practice is to aim for 3:1, which translates to an average customer, bringing in three times the cost spent to acquire.
Research by McKinsey shows that raising the customer retention rate by 5% results in increased profits of 25% to 95%. Break down LTV with customer segments to reveal your most valuable segments.
Sales Conversion Rate
Sales Conversion Rate measures the percentage of leads that become paying customers.
Calculation: (Number of Conversions ÷ Total Number of Leads) × 100
For instance, if your leads last month were 200, and the deals that were closed were 20, the conversion rate is 10%. This is a metric that should be monitored within the CRM based on the stage of the prospects.
Analyzing conversion rates by stages provides crucial information about:
- Conversion From Leads to Opportunities Indicates Quality of Marketing
- Opportunity-to-proposal conversion represents the effectiveness of qualification
- Conversion from proposal to close is indicative of sales skills and pricing alignment
As Gartner says, leader sales groups have success rates 30% more than those that focus more on volume than leads.
Customer Relationship CRM Metrics
Customer Churn Rate
Customer Churn Rate measures the percentage of customers who stop doing business with you during a specific period. This metric is crucial for CRM for customer service teams to monitor and address relationship issues proactively.
Calculation: (Customers Lost During Period ÷ Customers at Start of Period) × 100
A loss of 15 customers out of 300 at the beginning of the month translates to a 5% churn rate. This is a CRM measure that acts as an early warning system for relationship issues.
According to a study by Bain & Company, a 5% increase in customer retention can boost profits by 25% to 95%. Your CRM system helps you identify customers who are at risk of leaving by monitoring their interaction frequency, support tickets, and product usage. Analyze customer churn by segment, contract value, and time to see which ones require urgent attention.
Net Promoter Score (NPS)
Net Promoter Score gauges customer loyalty by asking: "How likely are you to recommend us to a friend or colleague?"
Calculation: % of Promoters (9-10 ratings) - % of Detractors (0-6 ratings)
Responses on a 0-10 scale classify customers as Promoters, Passives (7-8), or Detractors. An NPS of +50 is excellent, while anything above +70 is world-class. This CRM metric predicts organic growth potential better than satisfaction scores alone.
According to research published in the Harvard Business Review, companies with high NPS scores grow at more than twice the rate of competitors. Track NPS trends over time rather than focusing on single scores.
Customer Retention Rate
Customer Retention Rate measures the percentage of customers you keep over a specific period.
Calculation: ((Customers at End - New Customers During Period) ÷ Customers at Start) × 100
Starting with 500 customers, gaining 100 new ones, and ending with 550 means you retained 90% of your original base. This CRM metric complements churn rate by highlighting retention success rather than loss.
Sales Efficiency CRM Metrics
Sales Cycle Length
Sales Cycle Length tracks the average time from first contact to closed deal.
Calculation: Total Days to Close All Deals ÷ Number of Deals Closed
If five deals took 30, 45, 60, 45, and 50 days to close, your average sales cycle is 46 days. This CRM metric impacts cash flow forecasting and capacity planning. Shorter cycles mean faster revenue realization and more deals per sales rep annually.
Businesses with well-defined sales processes see 18% higher revenue growth than those without, according to CSO Insights. Compare cycle length against industry benchmarks and historical performance.
Lead Response Time
Lead Response Time measures how quickly your team contacts new leads after they express interest.
Calculation: Time Between Lead Submission and First Contact Attempt
Research by Harvard Business Review found that companies responding to leads within one hour are seven times more likely to qualify them than those waiting even two hours. This CRM metric dramatically influences conversion rates because speed demonstrates attentiveness and urgency.
Your CRM should alert sales reps immediately when high-value leads arrive and track response times automatically.
Win Rate
Win Rate calculates the percentage of opportunities that result in closed deals.
Calculation: (Number of Closed-Won Deals ÷ Total Number of Opportunities) × 100
Closing 30 deals from 100 opportunities yields a 30% win rate. This CRM metric reflects sales effectiveness, competitive positioning, and qualification accuracy.
Top-performing sales teams typically achieve win rates between 20-30%, according to Miller Heiman Group research. Analyze lost opportunities to identify common objections or competitive vulnerabilities.
Revenue-Focused CRM Metrics
Average Deal Size
Average Deal Size measures the typical revenue per closed opportunity.
Calculation: Total Revenue from Closed Deals ÷ Number of Closed Deals
Closing 20 deals worth $100,000 total means your average deal size is $5,000. This CRM metric helps forecast revenue and evaluate whether sales teams pursue appropriately sized opportunities.
Tracking deal size trends reveals market shifts and sales strategy effectiveness. Declining average deal size might indicate increased price sensitivity in the market, sales reps pursuing easier smaller deals, or product positioning issues.
Pipeline Coverage Ratio
Pipeline Coverage Ratio compares pipeline value to revenue targets.
Calculation: Total Pipeline Value ÷ Revenue Target
If your quarterly target is $500,000 and your pipeline contains $1,500,000 in opportunities, your coverage ratio is 3:1. Most sales organizations aim for 3-4x coverage to account for deals that won't close. This CRM metric ensures adequate opportunity flow to meet targets.
According to Sales Benchmark Index, organizations with insufficient pipeline coverage (below 3x) miss revenue targets 70% of the time. Monitor coverage trends throughout each quarter.
How to Select the Right CRM Metrics for Your Business
Not every CRM metric deserves equal attention. Start by identifying your primary business objective: growth, profitability, or market share. Understanding the fundamental objectives of CRM in your organization will guide which metrics to prioritize.
Growth-focused businesses should prioritize:
- Customer Acquisition Cost
- Lead Conversion Rate
- Pipeline Coverage Ratio
- Sales Cycle Length
Profitability-focused businesses should emphasize:
- Customer Lifetime Value
- Customer Retention Rate
- Average Deal Size
- Win Rate
Market share-focused businesses need:
- Net Promoter Score
- Customer Churn Rate
- Competitive Win Rate
Identify 5-7 key metrics to track in line with your strategic objectives. A study from MIT Sloan Management Review finds companies tracking fewer and more meaningfully aligned metrics are more successful than companies focused on many non-related data points.
Common Mistakes When Tracking CRM Metrics
Vanity Metrics Over Actionable Insights
Most organizations report on non-actionable key metrics. Total leads produced sounds good but doesn't mean a thing when considered in the context of conversions. There's relevance in CRM key metrics that center around resource, cost, or process improvement.
Ignoring Metric Relationships
CRM metrics interact with each other in many ways. This means the optimization of any particular metric can have undesired effects on other metrics. For example, a very aggressive decrease in your Customer Acquisition Cost could negatively impact the quality of your leads, which could have a detrimental effect on your conversion rates and, in turn, your Customer Lifetime Value.
Inconsistent Measurement Periods
Comparing monthly metrics against quarterly targets, for instance, or combining calendar months and rolling 30-day periods, creates complete confusion. Establish a set of standardized measurement periods and then stick to them. Your CRM should automatically align the reporting periods so apples can be compared to apples.
Lack of Benchmarking Context
That's all well and good, but what does a 15% conversion rate really mean? Always compare CRM metrics against industry benchmarks from research firms, historical performance trends, and internal team performance distribution. This gives raw numbers meaning; it makes them performance indicators.